
The EU imported 423,000 metric tonnes (MT) of wood products from Indonesia in the year ending May 2019, a 1% reduction compared to 428,000 MT in the year ending May 2018. However, in value terms EU imports from Indonesia increased 9% from €782 million to €855 million in the same period. As the Euro weakened against the US currency during this period, the increase in dollar value was less significant, up 5% from US$932 million to US$976 million.
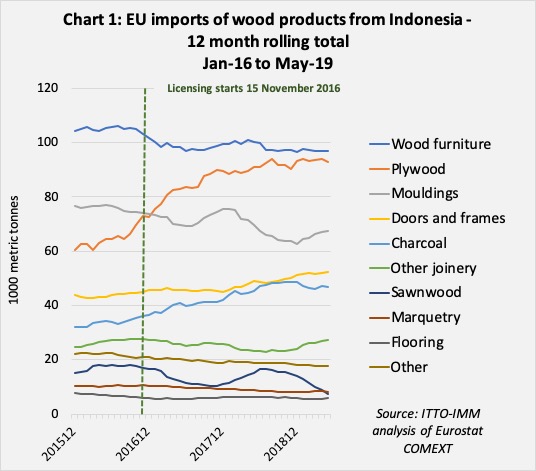
In the year to May 2019, a rise in EU imports of Indonesian doors and other joinery products was offset by a decline in imports of Indonesian S4S sawnwood products. EU imports of Indonesian wood furniture were stable during this period, halting the slow decline of previous years. After a period of growth in 2017 and early 2018, EU imports of Indonesian plywood and charcoal stabilised at the higher level in the 12 months to May 2019. While varying widely each month, total EU imports of Indonesian mouldings/decking in the year ending May 2019 were at the same level as in the previous 12-month period (Chart 1).
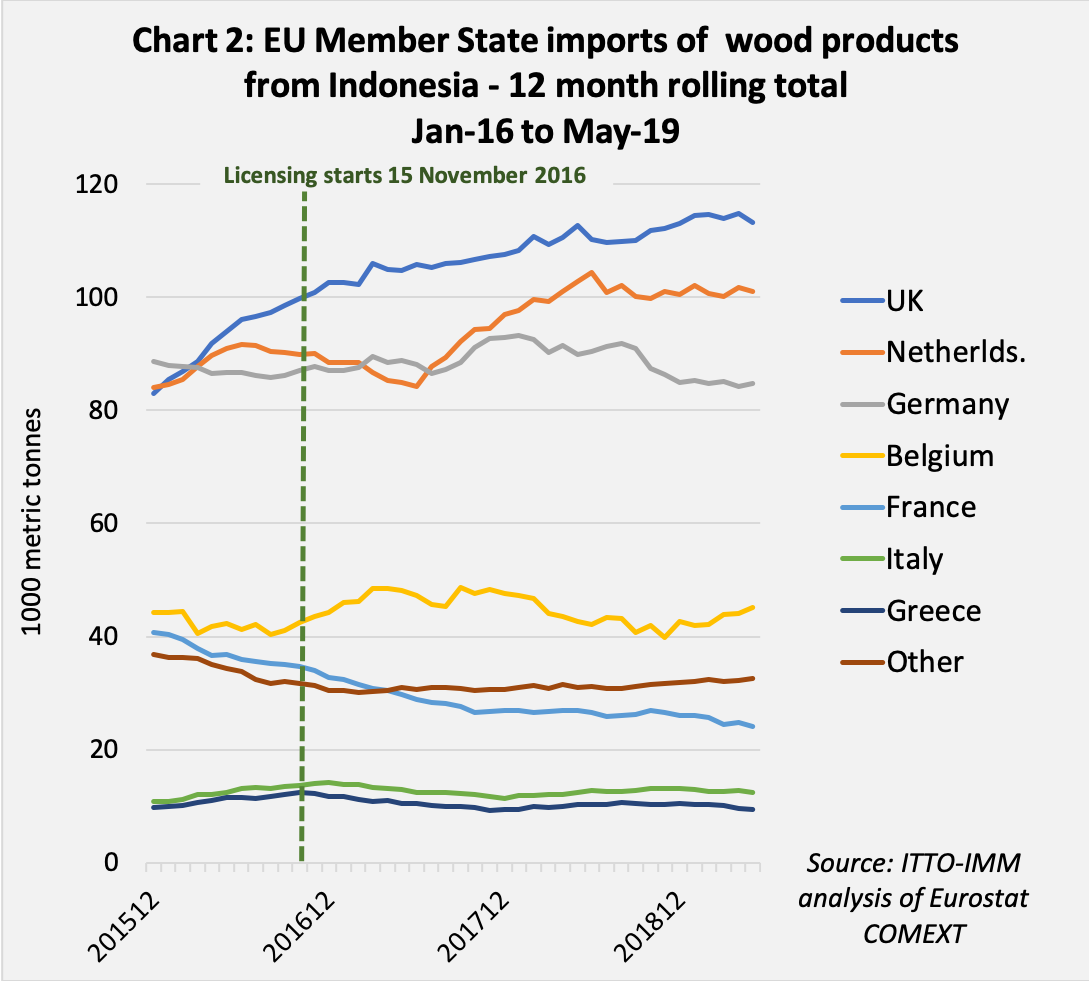
Imports of Indonesian wood products stabilised at a high level in the Netherlands and the UK in the 12 months ending May 2019. Imports were slipping in Germany, France and Greece but rising in Belgium and Spain during this period. Imports in Italy were broadly flat (Chart 2).
Although the volumes involved are small, in percentage terms there were potentially significant upticks in imports of Indonesian products in several minor EU markets for Indonesian products in the year ending May 2019 compared to the previous 12 month period, notably Czech Republic (+39% to 2,100 tonnes), Ireland (+37% to 1,700 tonnes), Romania (+11% to 1,450 tonnes), and Portugal (+99% to 500 tonnes).
In total, the EU imported 283,000 MT of pulp and paper products from Indonesia in the year ending March 2019, a 2% decline compared to 288,000 MT in the year ending March 2018. However, in value terms, EU imports from Indonesia increased 10% from €248 million to €273 million in the same period. In dollar terms, the value increased 9% from US$291 million to US$316 million.
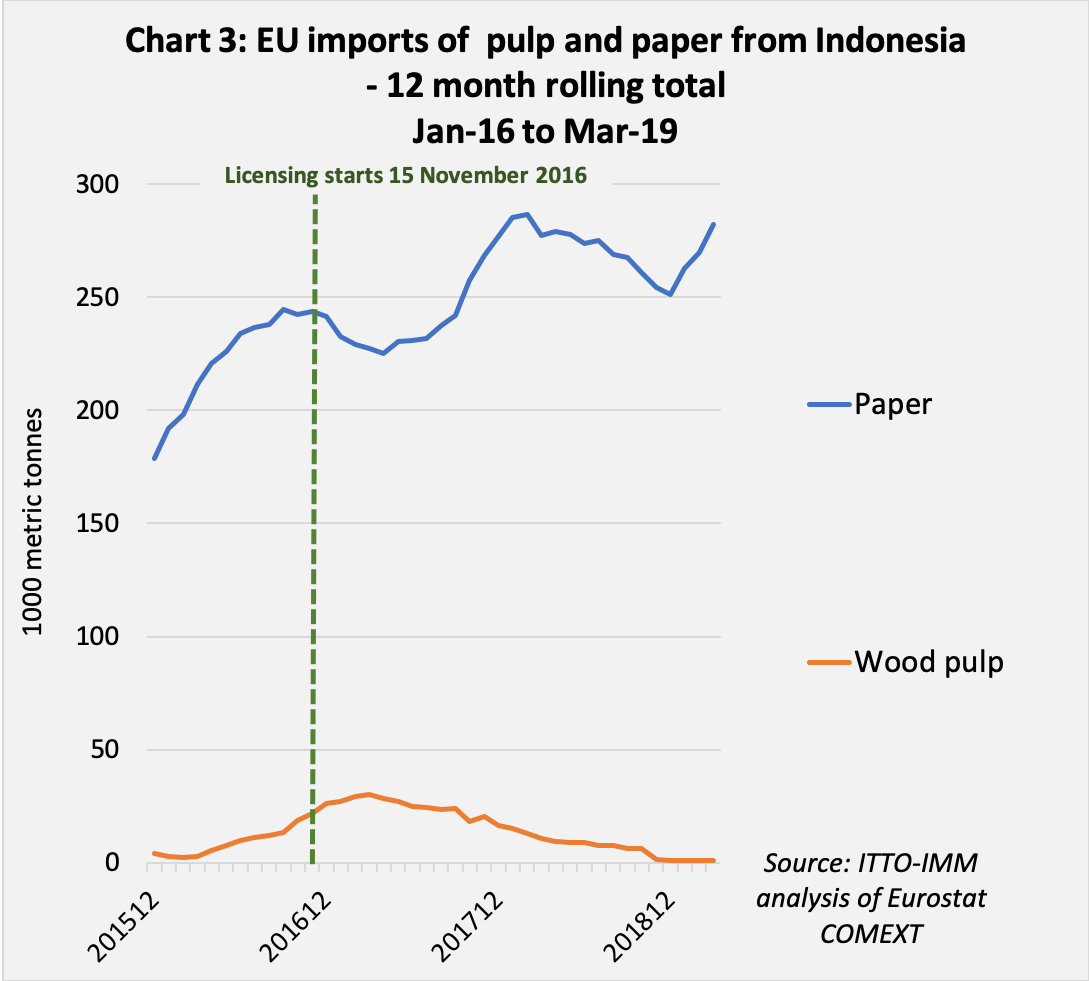
After slowing in 2018, the tonnage of EU imports of Indonesian paper products increased in the first quarter of 2019. EU imports of pulp from Indonesia have declined to near zero so far in 2019. (Chart 3).

After a downturn in 2018, imports of Indonesian paper products returned to growth in the UK, Italy, and Slovenia is the first quarter of 2019. Imports in Greece, Spain and Germany continued a long–term rising trend during this period (Chart 4).